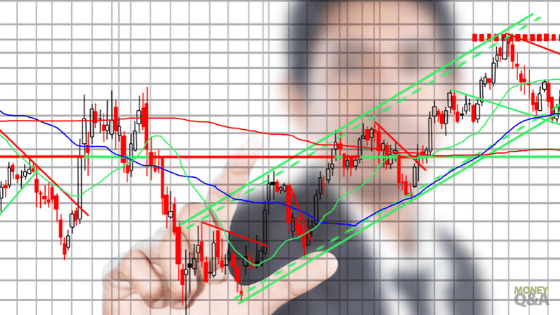
Stock trading is not a child’s game. It is one of the most sophisticated investment businesses in the world. Those who are trading the stock market for a long period of time, knows the importance of timing and proper trade execution.
If you do things in the wrong way, you are bound to lose money. The majority of the traders in Hong Kong use the indicators to find the perfect setup in the stock market. But indicators need to be used in a very precise way. In fact, you need to know which indicators will suit them best. Choosing the wrong indicators can result in big losses and force you to lose money most of the time.
ADX, often known as the average directional movement indicator, is a famous trend trading indicator. If you can use this tool as a professional trader, you can expect to trade the major stock. Go through this article very carefully since we are going to highlight some of the key facts you need to know about the ADX indicator.
ADX line cross over
The ADX indicator has three important lines. The +DI line is green and the negative DI line is red. But the color code of the ADX indicator might vary as different platforms have different default functions. But the function of the DI lines does not vary.
The + DI line crossing above the – DI line is an indication of a bullish trend and the traders need to search for buying opportunity. On the contrary, when the – DI lines cross below the + DI line, the traders need to look for the selling opportunity. Based on this cross over, traders can find some of the most decent trades and take some serious steps in the investment business.
Analyzing the volatility
The ADX indicator can be used to analyze the volatility of the major stocks. The third line in the ADX indicator is our volatility indicator. When the third line gains north momentum, it means the volatility is going higher.
On the other hand, if deeps down, you can expect a low level of volatility. You should not take any trade in any stocks when the volatility line is at the upper or lower extreme level. It is important that you follow the safety protocols or else it will be really tough to make a serious profit from this market. Think about the risk exposure and try to trade in a stable market condition.
Use it in the daily time frame
You need to use the ADX indicator in the daily time frame only. If you use it in the lower time frame, you might not be able to find great trades. Traders often become confused by seeing the successful rate of this indicator in the higher time frame.
But things will quickly go south of you use the ADX indicator to trade the lower time frame data. If necessary, you can use the demo account and see how things go in the lower time frame. It won’t take much time to stop using this tool in the lower chart.
Analyze the news data
Being a stock trader, you must analyze the news data on a regular basis. Ignoring the news data is one of the key reasons why novice traders are losing money. The professional traders love to trade the market with discipline and they never take aggressive steps.
To be a top trader in the world, you must have a strong analytical ability to understand the news. Without this, you can’t trade the stock market with low risk. Use your news data to reinforce your technical analysis. This process can significantly improve your trading skills and make you a top trader. So, be careful about the use of the ADX indicator and the news analysis.
