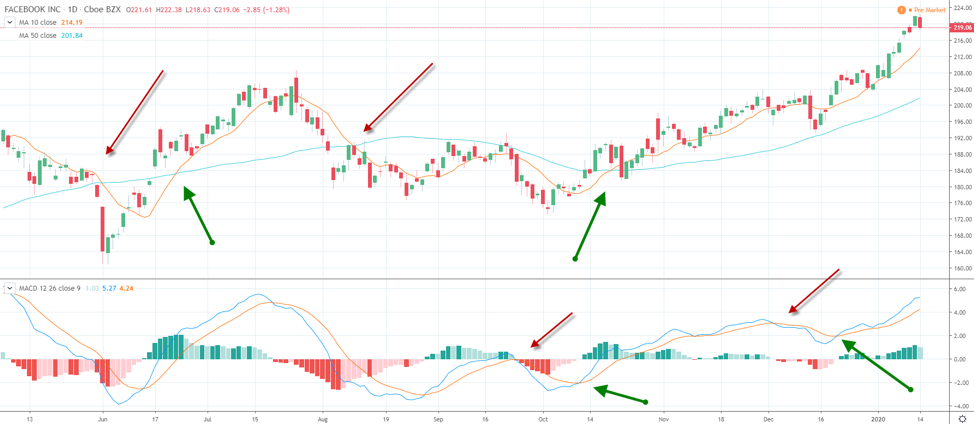
Trading shares online can be a profitable endeavor if you take the time and effort to learn how to trade shares online and use a solid trading platform. Many of the platforms that are available today, provide access to charting software that can allow you to graph charts and analyze their historical movements to provide you with a gauge of future price movements.
In addition, many of the platforms you can trade shares online on will offer you an economic or financial calendar. These calendars could include information that is relative to online share trading, such as a non-farm payroll report or even a company’s earnings release.
How to Trade Stocks Using Technical Analysis
There are several techniques you can use to track the future movements of a stock price and trade shares online. This could include trend following as well as momentum strategies. A trend is a movement in the price of the stock that continues to perpetuate. One of the best ways to use a trend following strategy is using a moving average crossover strategy.

A moving average is the average of a certain number of periods. For example, a 10-day moving average is the average of the past 10-days. On day 11, the first day of the average is lost in the calculation.
A moving average crossover strategy requires that you follow 2 or more moving averages. When a short-term moving average (the 10-day moving average), crosses above a longer-term moving average (the 50-day moving average).
This would generate a buy signal. When the 10-day moving average crosses below the 10-day moving average, a sell signal is generated. As you can see with a graph of Facebook (FB) shares, the trend line crossover represents the middle of a trend and there is generally follow through.
When you use a trend following trading strategy the key is to develop risk management that works in tandem with a trend following. You can use a stop loss and take profit. You can use a trailing stop loss. You can also keep the positions open and only exit when the signal reverse.
For example, you enter FB when the 10-day moving average crosses above the 50-day moving average. You exit and reverse your position when the 10-day moving average crosses below the 50-day moving average.
An alternative strategy might be to use momentum. One of the best momentum trading strategies uses the MACD (moving average convergence divergence) index. This study uses moving average and evaluates the differences between the 2-moving averages.
When the spread between the 12-day moving average and the 26-day moving average known as the MACD line, crosses above the 9-day moving average of the MACD line (known as the MACD signal line), a buy signal is generated. When the MACD line crosses below the MACD signal line, a sell signal is generated. This signal tells you when momentum is accelerating.
By using trend-following or momentum, or a combination of both you have a tool chest that will provide you with a potential future direction of a stock.
